What has driven volumes to the close globally in recent years and why is this phenomenon so important for market participants?
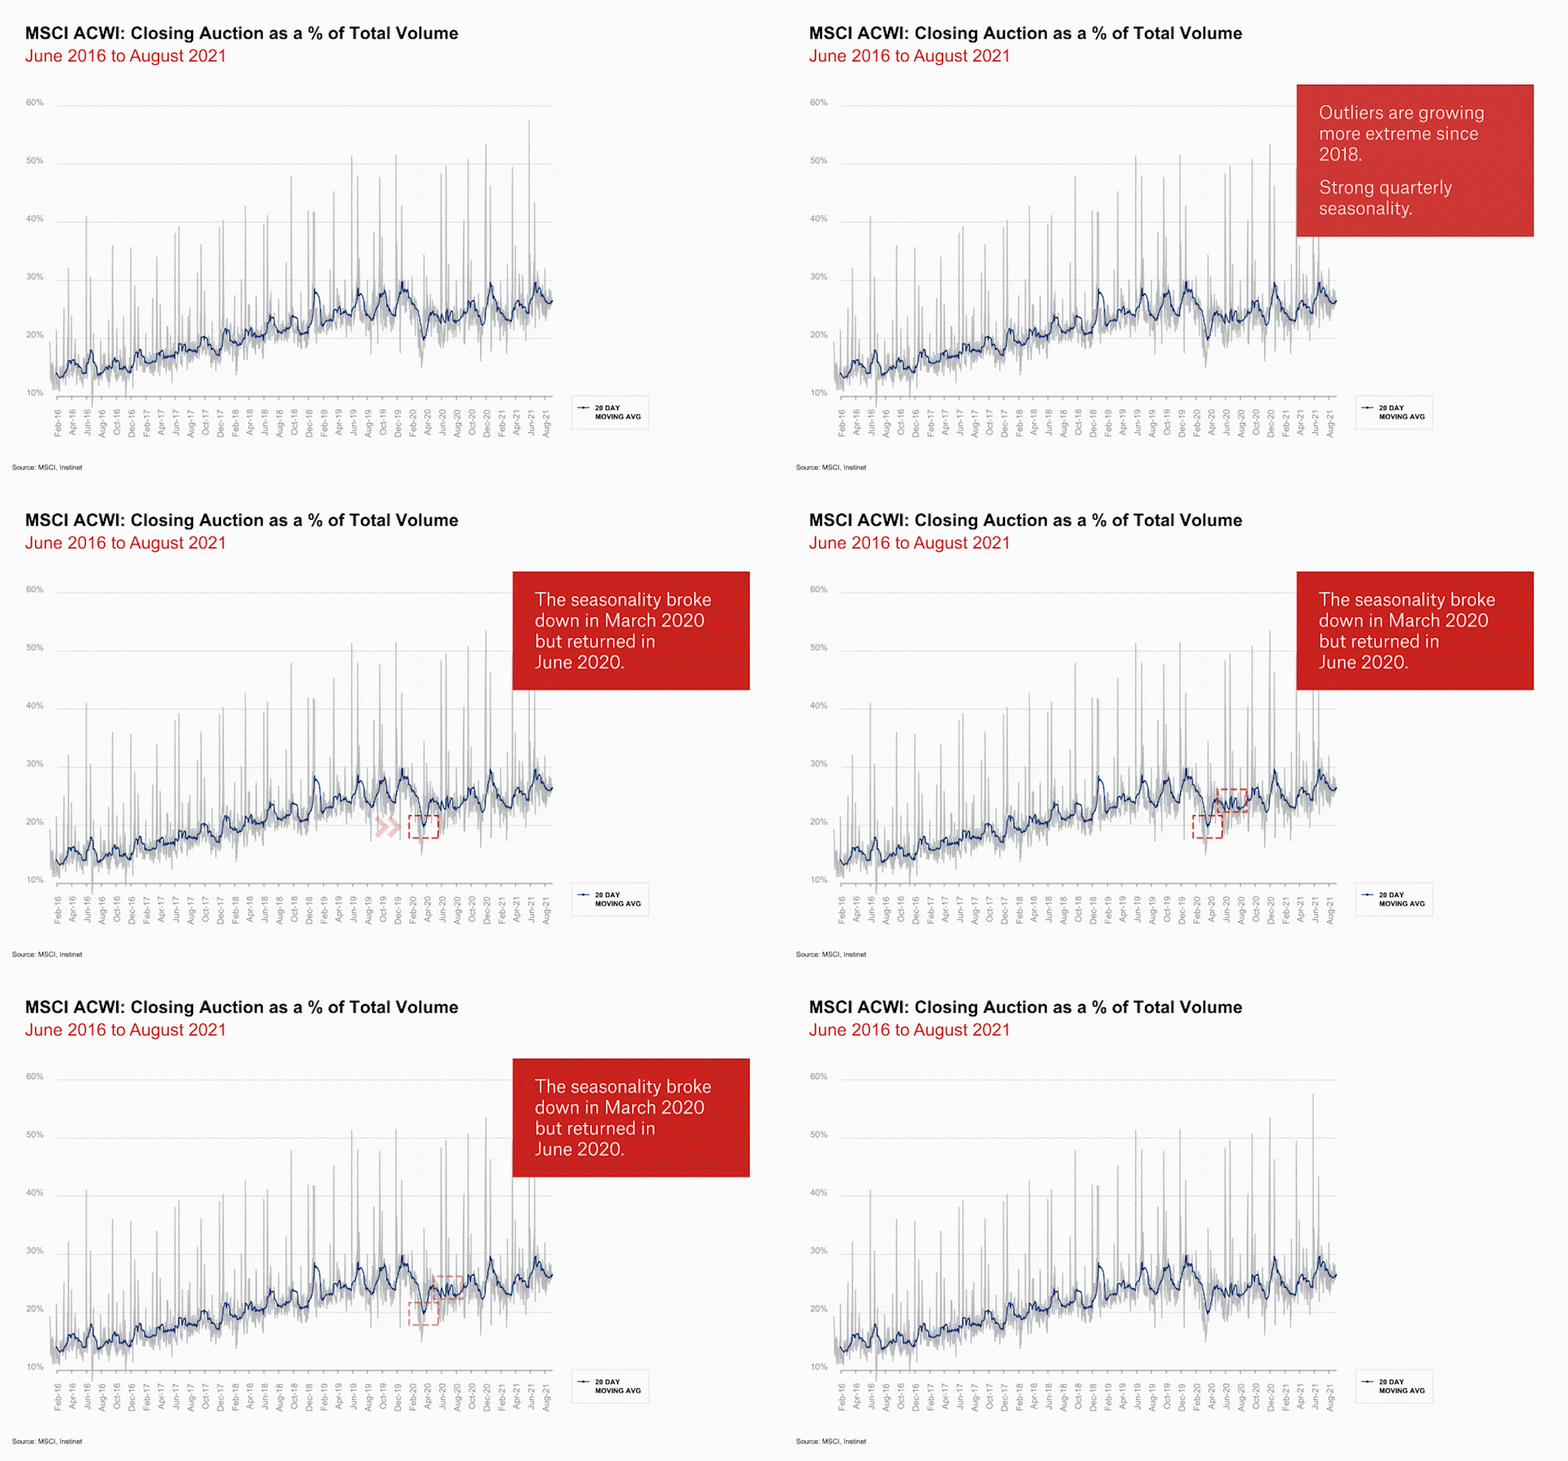
Volume patterns have changed drastically over the last decade, particularly around the rush leading up to and into the market close of each day. Increasingly, the trend observed is that the greatest amount of a trading day’s volume and value is exchanged in merely the final minutes or even seconds of the Closing bell. The volume has been growing aggressively in quarterly cycles, as well. In 2016, the 20-day moving average of Closing Volume was only 6% of daily volume, but reached a record high of almost 16% in December 2019.

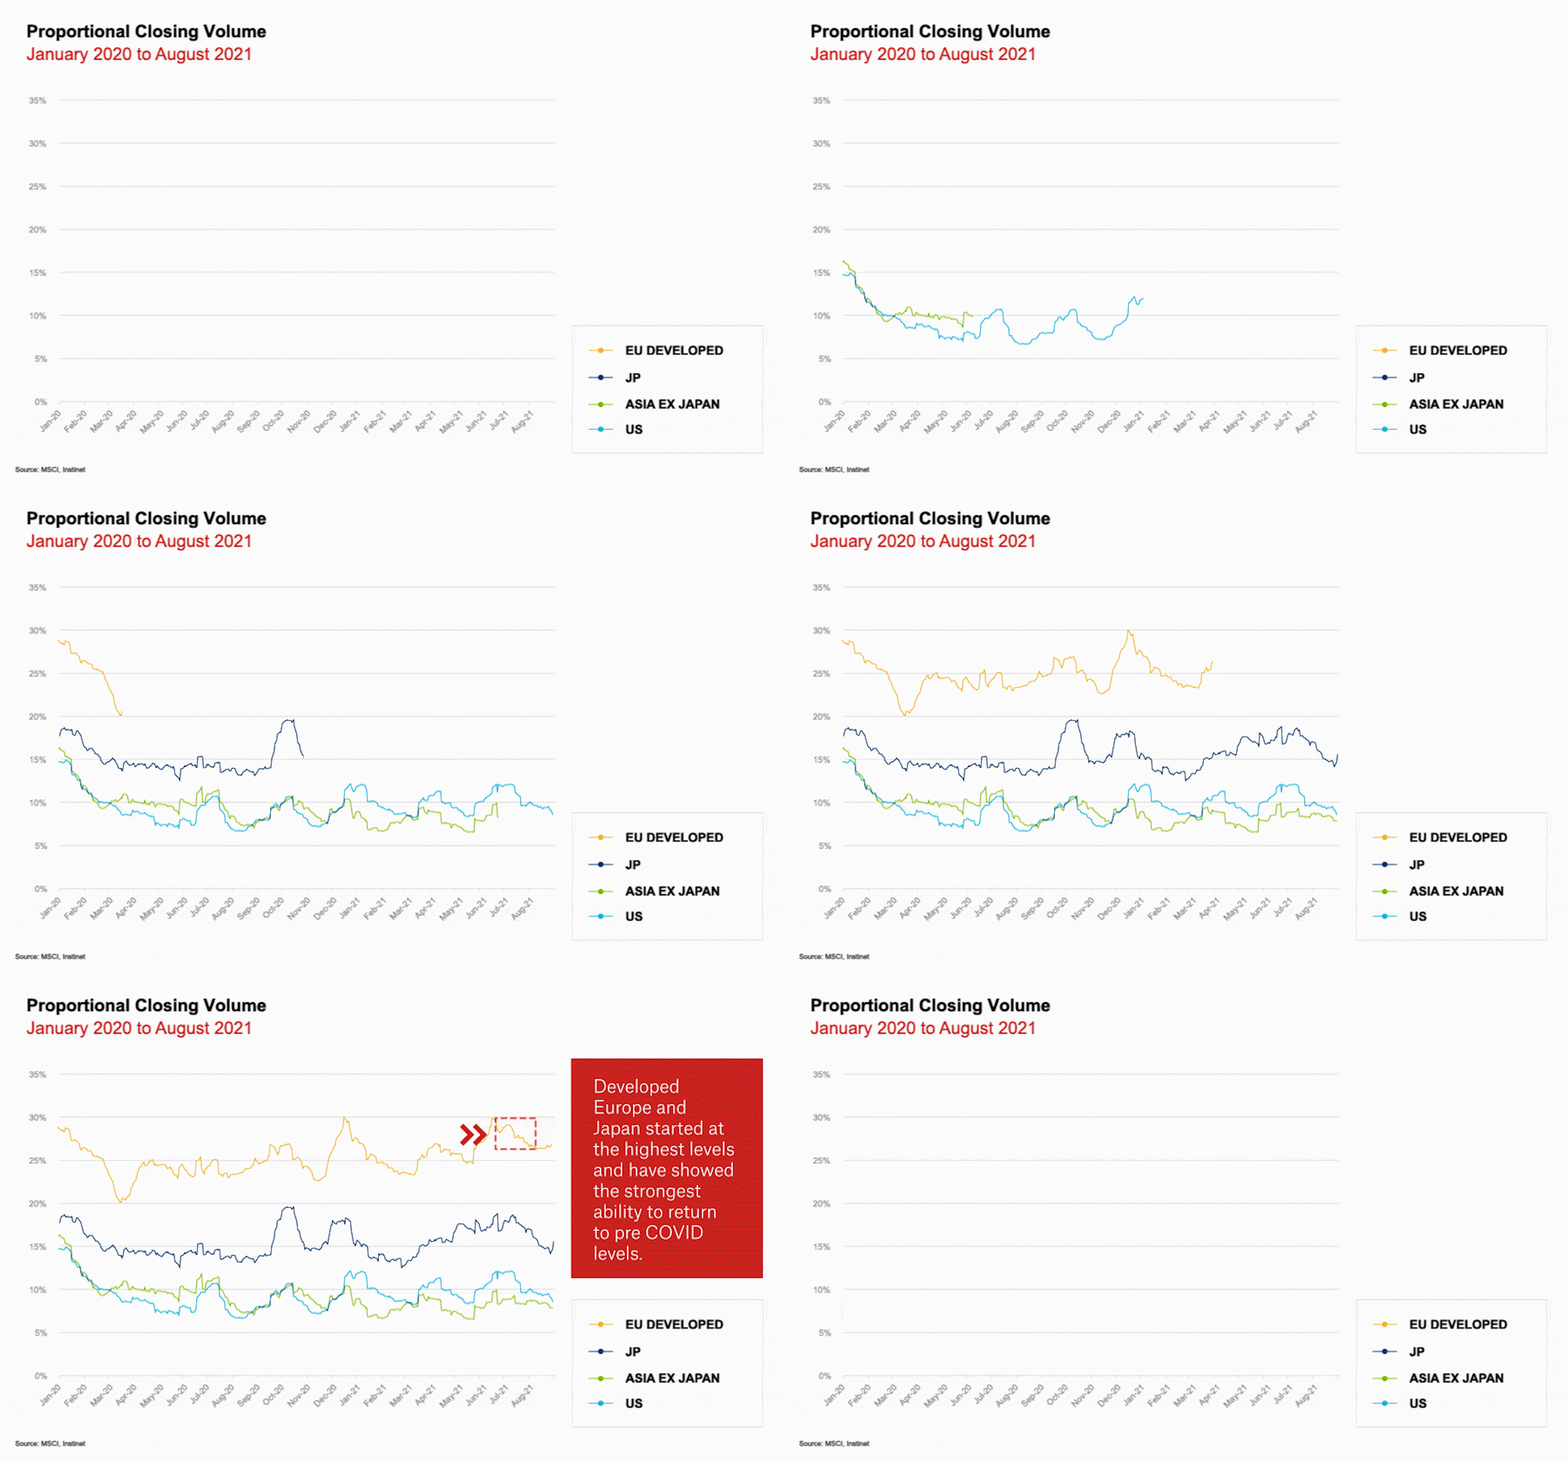
Developed Europe is the region with the most proportional volume on the close—about 2X the global average. Closing auction volumes in Developed Europe have been trending aggressively higher over the last four years—even more than other regions–ranging from a moving average of 13% in February 2016 to a new record high of 28% in December 2019.
Emerging Europe has been quite stable when compared with other regions, generally trading in a band between 7% and 10%. Closing auction volumes in the US have been rising gradually over the last four years, hitting a new high in December 2019 of almost 14%, based on the 20-day moving average. Similar to other regions, closing auction volumes in Japan have been trending higher, spanning from a low of 5.5% in February 2016 to a high of 18% in December 2019. Asia Ex Japan has also been quite stable within a band ranging generally from 8% to 10% from 2016-2018.
Why is this happening?
We think there are a few factors to consider. The close is being used as a strategy. It is the only time of the trading day when such a huge culmination of diverse market participants with varying strategies and benchmarks come together for a single point in time with such uniform urgency. Intraday, market participants choose to trade at many different venues but at the close they all gather at the same place. The majority are likely there seeking to avoid market impact, exchanging and seizing massive liquidity without leaving time for the market to react. On top of this, there is also incremental volume from imbalance offset opportunities that cause even more trading.
With regard to pricing, by the end of the day, there are more transparent opportunities to be found with increased clarity on where the price is going in the time left. All of these factors add up to a frenzy of liquidity that has created a kinetic energy drawing in both people and algorithms to be part of a cycle that self-perpetuates and is reinforced each day.
What is Instinet’s Global Auction Monitor and has it uncovered any noteworthy trends so far?
The Global Auction Monitor is a monthly global microstructure analysis report that focuses exclusively on auction trends for each country in the MSCI ACWI index. More simply, it is an interactive tool that helps investors quantify auction volume trends across global markets.
To arrive at calculations, we first break down the world using MSCI indices to define each market. We then calculate a volume profile for each day based on total shares executed on a minute by minute basis. The profiles themselves are interesting and valuable, but for the purpose of the Global Auction Monitor we focus only on proportional volume of the morning open auction, the afternoon closing auction and the last 30 minutes of the day. Details on all calculations are provided each month in the appendix of the report and the FAQ worksheet that accompanies the report’s interactive spreadsheet.
Since closing auction volume can vary significantly with scheduled events such as index rebalances, we offer three separate time series in the interactive application: ‘All’ Trade Days, which includes all data, ‘Normal’ Trade Days which encompasses closing auction proportional volume less than a 2 standard deviation diversion from the 20- day rolling average, and ‘Extreme’ Trade Days which covers closing auction proportional volume more than a 2 standard deviation diversion from the 20-day rolling average. In the Global Auction Monitor, we present the ‘Normal’ Trade Day data unless otherwise noted.
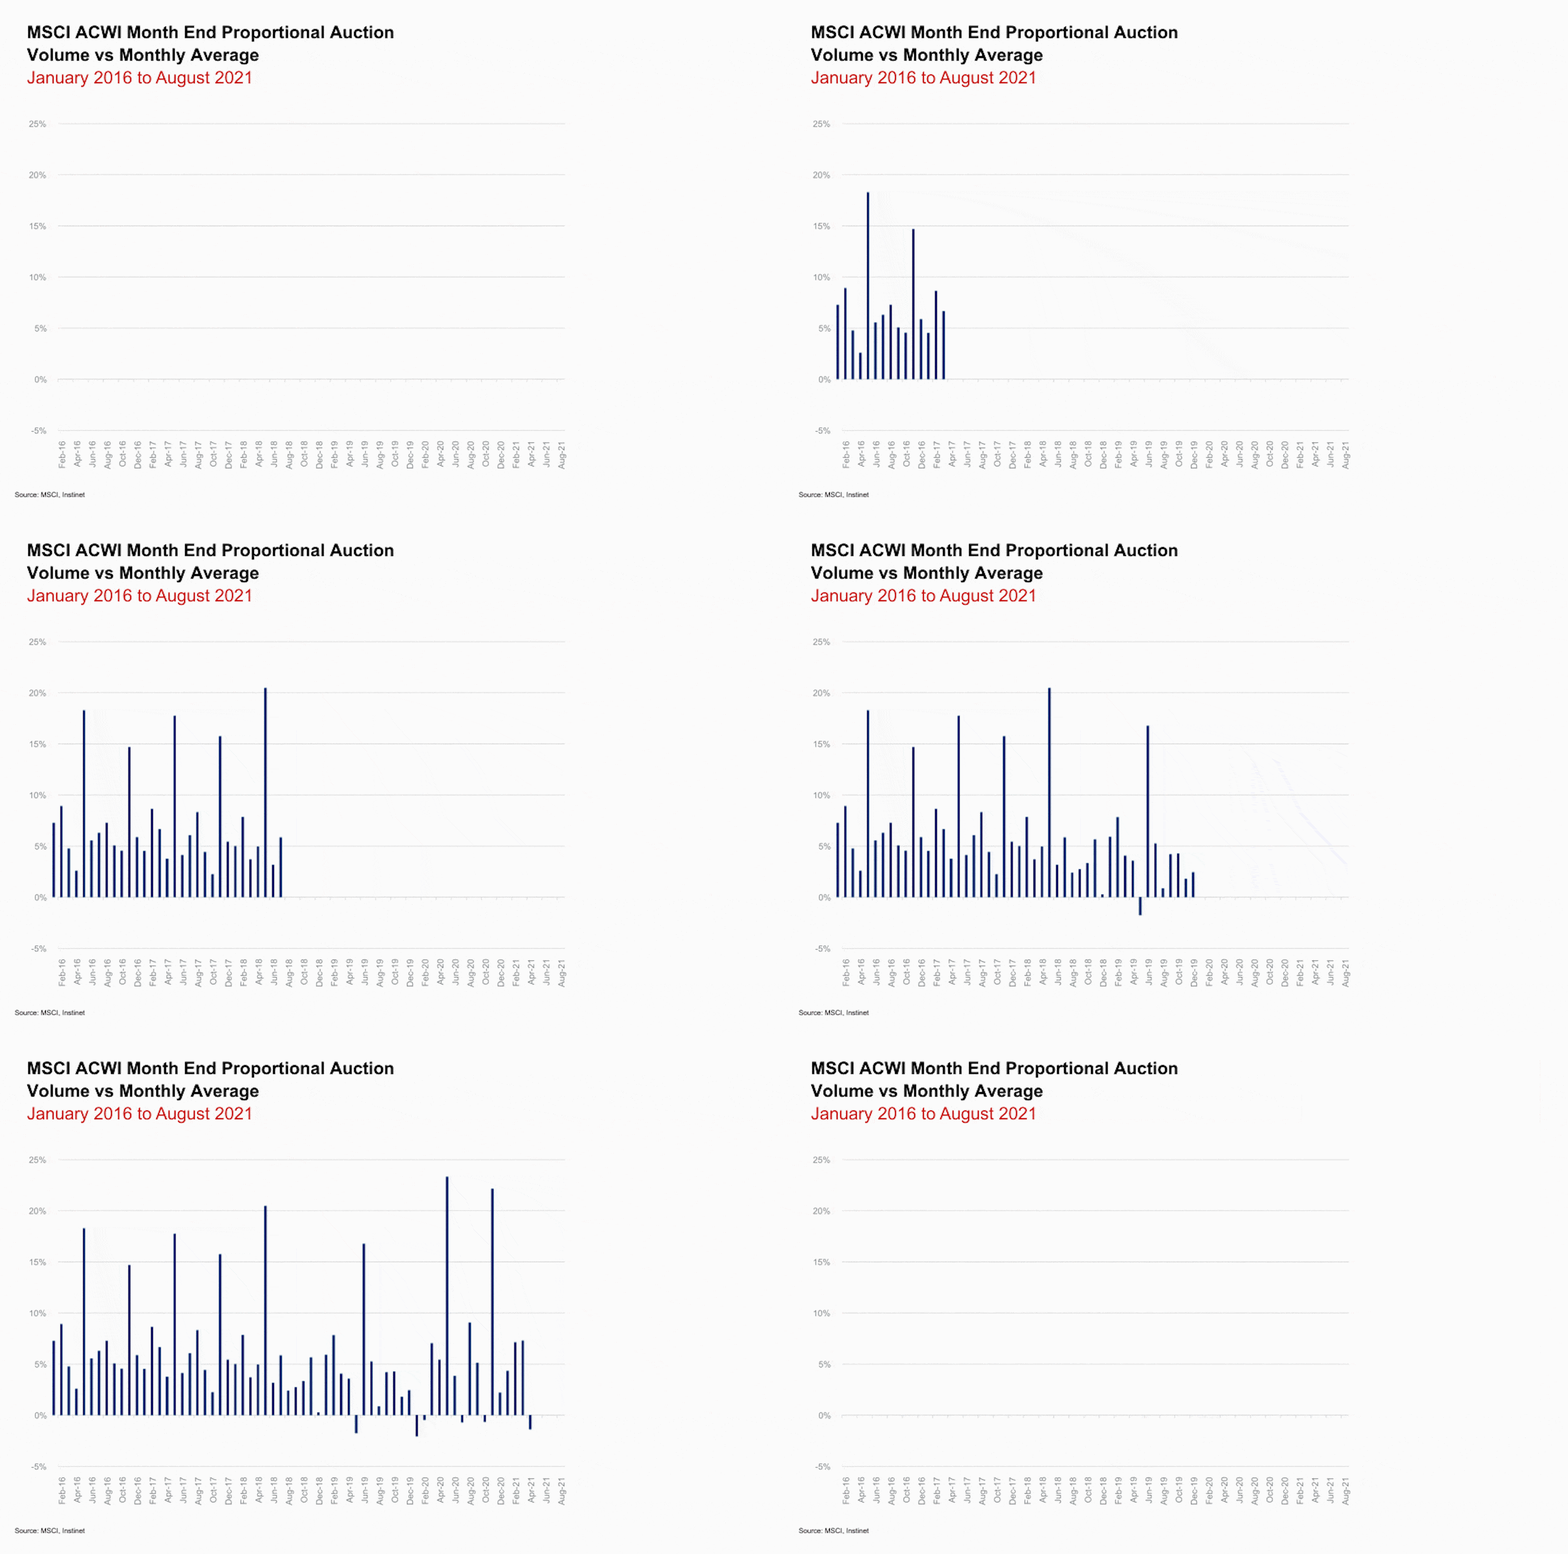
One of the most interesting insights we have gained from the product is to observe a quarterly seasonality effect from which we see an increase in proportional closing auction volume in the third month of each quarter – even after removing the skewing influence of index rebalances. The effect is consistent through time and seems to be global in nature – impacting virtually all countries in our study. We attribute this pick up in closing auction volume in March, June, September and December to quarter-end asset allocation shifts to passive instruments i.e., ETFs/index funds. This theory is further supported by the fact that the effect is most powerful in December, which suggests that in addition to a quarter-end asset allocation effect there is also an end-of-year passive asset allocation effect that is having a microstructure impact.

How did the COVID-19 pandemic impact the close and continuous trading regionally?
March 2020 was an exceptional month in many ways for the global economy and microstructure metrics. Closing auction proportional volume was unusually low amid the volatility of March 2020 and that brought closing auction volumes back to 2018 levels. Despite some retreat seen in the August 2021 Global Auction Monitor, global closing auction volumes are gradually climbing back to pre-COVID levels. While closing auction volumes have rebounded in other regions, in Asia Ex Japan we are not seeing a return to pre-COVID levels yet.

Breaking the recovery down by region, Developed Europe has now fully recovered and even surpassed pre-COVID highs in recent months. Closing auction volumes have rebounded faster in Developed Europe than any other region. Last month, it was the only region to observe an increase in closing auction volumes. Over a long-term view, closing auction volumes in Emerging Europe have been quite stable relative to other regions. In July 2021, the series hit a new record high and has come back a little in August.
Similar to other regions, Japan saw the closing auction proportional volume fall in March 2020 but closing auction volumes in Japan have been trending higher and have also rebounded to pre-COVID levels. Asia Ex Japan saw a rebound in July and August but overall levels are far from pre-COVID levels. In March 2020, we observed closing auction proportional volume falling to the lowest level in about two years.
The US closing auction was unusually low in March 2020—breaking traditional seasonality patterns-resulting in three-year lows for closing auction volumes. Since that time, however, the volumes have been recovering.
How did market participants adapt trading processes to the changes, and in what ways can venues/order types help traders optimise their engagement with liquidity at the close?
The continued migration of volume to closing auctions, and the last minutes of continuous trading, makes it that much more important to engage with the various liquidity sources and tools at and around the close. There are great opportunities for tactical liquidity seeking in the last two minutes – but the price improvement profile changes. Displayed quote sizes can be very large – sometimes sizable portions of the ADV.
A well-tuned trading system can optimise liquidity. Instinet uses a specialised “Close Overlay” to opportunistically trade in various ways in and around the close. Modern execution algos should incorporate imbalance and indicative size feeds, use order types such as imbalance offsets, and integrate TAL and other alternative close venues, to minimise impact and maximise liquidity in closing auctions. Algorithms should also account for market dynamics going before the close too, where liquidity can be highly concentrated and impact and spread costs minimal. The algorithms that account intelligently for these various effects can perform notably better.
Trading near the close can be very unlike trading during the rest of the day, providing a unique set of opportunities. Having the right tools, innovations and data that can help make the most of it is critical. It is worth understanding the information that comes out of the close and brokers should be held accountable for providing it.
What could go wrong with such big market events bunching up at the end of the day? What if Level 3 circuit breakers fail?
Rather than wonder if exchange A can backup exchange B at the close, as an industry we should wonder if an improved/extended competitive framework is needed to improve the closing auction so that organically, by market forces, there are alternatives on the sidelines. Even with a perfect backup system, traders and institutions have to be ready with their strategies and technologies in the right place to respond and react if something fails during the close. There is a long way to go to make instantaneous backup as robust as the industry already has for intraday trading.