
Michael Steliaros, Global Head of
Quantitative Execution Services,
Goldman Sachs
In today’s increasingly complex and inter-related market environment, (i) information dissemination is occurring almost instantaneously around the world, (ii) market participants and financial products are more global in nature, creating or reshaping linkages across markets that didn’t exist just a few years ago and (iii) the electronification of trading is prevalent across most asset classes. Against this backdrop, algorithmic approaches to execution are at an arms race of consuming enormous amounts of data, coupled with the need to deploy more sophisticated models to process, stratify and produce useful forecasts out of such wealth (or chaos) of information.
The quintessential pillars of any execution modelling framework are risk and transaction cost. More passive, less impactful execution requires trades to be more spread out, thus carrying higher time risk. Conversely, to execute rather quickly one would incur higher cost/induce higher impact.
The question that naturally arises, is, “how can we better model risk and cost to optimally decide how much and how fast one should trade”? This quest of continuously improving risk and cost models, as well as optimisation processes, lies at the heart of algorithmic research. Below we highlight some of the topics that our team, the Quantitative Execution Services arm of Goldman Sachs, has been tackling and share some of our findings and observations.
Several market micro and macro challenges have changed the way we think about and model execution dynamics, be they regulatory, competitive pressure or economically driven. A tremendous amount of our research effort is directed towards solving the micro challenges including placement logic, venue selection, latency, high frequency signal research etc. In this article we deal with the more ‘macro’ effects—of minute-frequency and lower. Some of the key themes that have emerged over the last decade are:
The shift from active to passive investing – the rise of ETFs and other index tracking investment vehicles to the detriment of active investment management is a well-documented phenomenon. Our research suggests that there is a statistically significant relationship between passive fund and ETF ownership and volatility, specifically towards the end of the trading day, the closing auctions themselves and subsequent overnight dynamics. This is not necessarily apparent when looking at simple, close-to-close/daily volatility, as the effect has become more nuanced. Models predicting stocks’ intraday volume and volatility profiles (fundamental inputs in the cost and risk models we discussed already) can be significantly enhanced by incorporating factors related to the relative weight of passive ownership by index-linked instruments and flows in and out of said instruments.
Trading volumes have shifted dramatically toward the closing auction – which has an effect on market impact, both in continuous trading and at the close, through the changes in intraday volume and volatility dynamics. With a significant amount of intraday liquidity now in the close, traditional approaches to the estimation of daily market impact need to be reconsidered to incorporate close impact specifically and the accompanying shifts in higher frequency volatility. When considering trades that would last more than one day, the overnight dynamics that have arisen over the past few years pose complications that need to be examined in detail and lie beyond the realm of standard algorithmic approaches, as those are tailored to intraday trading paradigms only (figure 1).
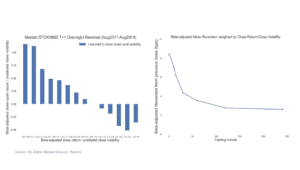
Figure 1: Overnight reversion dynamics for STOXX600 constituents (08/2017-08/2019).
Trading costs are notoriously difficult to estimate upfront – traditional approaches to assessing trade costs by market cap, ADV bucket or exchange constituency are limiting. The explanatory power (R2) of standard market impact models ranges between 1-3% in most major markets and provides little a-priori guidance of cost expectations to help inform the investment process. By using machine learning techniques like (semi-supervised) clustering, we can screen dozens of relevant microstructure features that allow us to group together assets with common trading characteristics and disentangle their non-linear dependencies. This has led us to develop 13 global trade clusters, ordered by easiest to most complicated to trade, helped inform our algo logic implementation and equally importantly, increased the goodness of fit of our cost models substantially. As an example, figure 2 depicts two stocks from the FTSE100 index that most algorithms would be parameterised to treat in a similar manner, yet according to our cluster model, should be treated quite differentially.
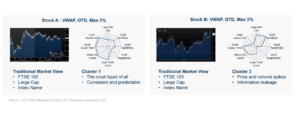
Figure 2: Stocks A and B broken by traditional and clusters view, left and right, respectively.
Intraday risk and correlations vary dramatically – it is a well-known, observable fact that volatility is higher after market open and lower the rest of the day. What has been less researched (and even more difficult to implement) is appropriate models to account for the significant fluctuation in the intraday correlation patterns amongst stocks’ performance. For example, beyond the easy to observe spike in volumes, the mere opening of the US market induces a doubling of volatility and a corresponding jump in correlations amongst all European names in the 5/10/15/30-minute interval after 14:30 GMT.
Figure 3 depicts these shifts in intraday correlation and volatility for S&P500 stocks, as an illustration, over the past six years. The observations that volatility toward the end of the day can be a quarter of that of the beginning of the day and correlations can conversely be five-to-six times higher—especially in periods of crisis—jointly warrant a more accurate covariance structure estimation of a set of trades than is broadly available. Portfolio-level modelling of risk gives rise to risk forecasts which are materially different (and more accurate) than the simple ‘addition’ of single stock variances.
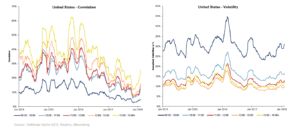
Figure 3: Shifts in intraday correlation and volatility for S&P500 stocks.
Over the last couple of years our team has incorporated many of the above insights, and a plethora of others, to our suite of Algorithmic Portfolio Execution products (APEX) to help our clients improve execution and reduce slippage. When we consider execution of anything more than a single stock, we utilise three modelling pillars to account for intraday (and overnight, where applicable) dynamics: risk, impact and multi-period optimisation.
Risk modelling accounts for the non-stationary nature of the covariance structure of stocks intraday and for overnight effects explicitly. Market impact estimation is more granular—it incorporates time of day effects and models are trained within a more homogenous set of stock characteristics to improve their explanatory power. Finally, optimisation of the balance between risk and cost is multi-period, dynamic in its horizon specification, and adaptive to the characteristics of the sets of stocks being traded and the execution objective.
Portfolio execution is a complex area of trading that has historically been approached with similar theorems and practices utilised in quant portfolio management, like factor models and mean-variance optimisation tools, typically ingesting daily data The ever-changing nature of global markets, the non-linear convolution of micro and macro effects, the non-stationary nature of the higher frequency covariance structure, the global intraday contagion effects and the continuously morphing impact of exogenous factors—like the active to passive shift—onto trading dynamics, render such portfolio approaches, as well as purely single-stock calibrated algorithms, relatively ineffective in trading portfolios of stocks.
The preponderance of computing power, coupled with innovative modelling techniques and excruciating curation and interrogation of masses of data, have allowed us to take a few steps closer —we believe—to deciphering some of the more pertinent questions of optimal execution. The beauty (and bane) of research in our industry is that this quest is fairly boundless in its scope.