By Huw Roberts, head of research and sales, Quant Insight
European reflation was a key theme for many investors in 2017. The idea that the continent was finally enjoying a self-sustaining cyclical upswing extended across asset classes and manifested itself in various trading expressions notably long EUR FX, long European equities, long financials in particular and/or short Fixed Income duration.
Global growth momentum appears to be waning but on Citi’s Economic Data Surprise Index it is Europe which is back in negative territory. Is the European reflation theme unwinding or is this a pause that refreshes? What are some of 2017’s consensus trades now discounting?
Quant Insight’s (Qi) algorithms have the ability to isolate and identify key macro drivers for different financial assets. In this instance, Qi analysis highlights the key drivers for European equity markets, valuations in European equity & rates markets and their sensitivity to certain macro scenarios, like a dovish or hawkish ECB, bounce in EU economic data.
Equities
Of the 43 macro factors we track for the Euro Stoxx 50 (SX5E), the top five categories of drivers that matter for the index currently, using our Short-Term models, are:
- Lower rate volatility
- Tighter credit
- Lower DM real yields
- Higher inflation expectations
- Higher US & Eurozone GDP expectations, as proxied by GDP Nowcast’s tracking GDP number
Reflation clearly matters for European equities, i.e. higher growth and inflation expectations are positives for equities but equally tighter financial conditions (higher real yields, rate volatility as a proxy for QE expectations and credit) are unwelcome.
Indeed, sensitivity to Eurozone GDP growth and inflation expectations has been rising over the last month. The charts show the percentage impact on the SX5E of a one standard deviation increase in each factor in isolation – EuroZone growth (Now-Casting tracking GDP) and inflation expectations (EUR Zero Coupon inflation swaps).
European equities can be well-explained by Qi currently. 18 of the 19 Euro Stoxx 600 sectors we track have model R-Squareds above 65%. Furthermore, the majority of these sectors are trading below Qi fair value.
What is interesting is that the biggest deviations are found in the cyclicals space:
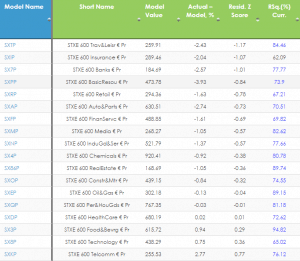
In other words, there is an element of fear already filtering through to European equities such that these sectors would welcome a dovish Draghi (all sectors want lower EUR 1y5y rate vol) or a resumption of stronger economic data.
Rates
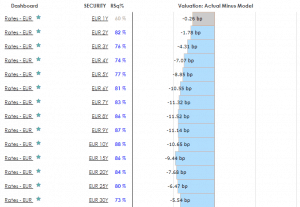
In rates, European yields have all fallen below Qi’s Short-Term model value. They are not hugely extended – 10yr yields for example have reached as much as 1 sigma below model as recently as Oct and Nov 2017 – but the picture is remarkably consistent across the curve.
The top drivers of European rates include global growth metrics (Chinese GDP, metal prices) suggesting Fixed Income is, to some degree, discounting a turn in the economic cycle.
Looking forward, Thursday’s ECB meeting is potentially an important inflexion point. Are the governing council members sufficiently confident in the cyclical upswing that they finally remove their easing bias? Or does the recent price action in financial markets plus waning growth momentum stay the ECB’s hand?
Qi will not opine on whether Thursday’s meeting is deemed dovish or hawkish, but it can provide a roadmap for an investor’s chosen scenario. In the chart below we screen Qi’s Short-Term model for European rates and their sensitivity to QE (1y5y rate vol) and inflation (ZC inflation swaps across the curve) expectations.
It’s the 5yr point of the curve which is currently most sensitive to shifts in the ECB’s QE stance and inflation projections. For example, a one standard deviation increase in both QE and inflation expectations, holding all other macro factors constant, equates to a 1.9bp increase in the yield of a 4yr swap 1yr forward. Note, yields in that 4-5yr point of the curve are all around 0.5 / 0.6 sigma below model. Tenors in the 7-15yr point of the curve are modestly richer (8yr yields are 0.7 sigma low versus model) but are less sensitive to Qi’s ECB policy stance metrics. For example, a one sigma move higher in QE/Inflation expectations equates to a 1.2bp increase in 8yr yields.
Either way, current valuations across the yield curve suggests markets are discounting only very minor tweaks to the ECB’s current dovish stance. Any hawkish innovation – a drop in the ECB’s commitment to increase QE in terms of size and/or duration for example – and paying the belly of the curve looks the optimal trading expression in EUR rates.
Qi combines investment expertise with high-quality data, proprietary algorithms and AI-driven machine learning models, to help institutional investors make sense of complex trading environments, make better investment decisions and ultimately improve their performance.