Over the past two years we have seen significant growth in the relative share of Market on Close (MOC) auctions around the globe. In some of the larger developed markets, the closing auctions can now account for as much as 20% of volume traded (1). The growing trend towards using the closing facilities, spurred by the continued growth of passively invested funds and the relatively low cost for liquidity at the close, leads to a number of important questions about how to best interact with this volume.
Over the coming weeks ITG is going to publish a series of papers that look at trading at the close and just prior to it. This paper is the first in the series and will serve as a primer for what is happening around the globe and how the various closing mechanisms work. We will also share some observations about the price elasticity of differing closing facilities in an attempt to begin addressing the question of which MOC mechanisms work most effectively.
We start with a quick survey of relative share of the Closing Auctions, as well as the last 15 minutes of continuous trading, in a variety of markets (2).
APAC
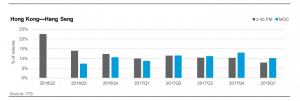
The Hong Kong Stock Exchange introduced a closing auction in two tranches, starting with the most liquid names in Q3 2016. The auction already accounts for just over 10% of volume in the Hang Seng index. The chart above clearly demonstrates that almost all of that volume was previously traded in the final 15 minutes of continuous trading.
Hong Kong has taken a European approach to the close, with the auction being run separately from the continuous trading session. The auction starts at 16:00 Hong Kong time, with a randomized close between 16:08 and 16:10.
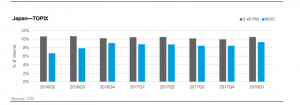
The MOC facility has lower relative share than most developed markets, and has witnessed far more modest growth than many peers. This may be explained by the continued high levels of VWAP-style trading in the Japanese markets.
The Closing Auction (called the Itayose) runs at 15:00 Tokyo time and is a separate book from
that of continuous trading. Market orders placed in the auction are assigned a limit price equal
to the calculated daily limit price for a given stock. 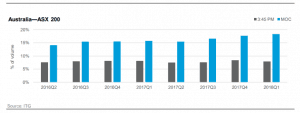
The ASX 200 has seen a nearly 30% rise in closing auction activity over the last two years (1) Our analysis focused on stocks included in market-level indices.
Stocks in the ASX 200 have seen a near 30% rise in Closing Auction market share over the past 2 years. During the same time period, relative share during the last 15 minutes of trading has been virtually flat. The Australian Stock Exchange closing mechanism runs separate from the continuous trading facility. Orders are entered during the Pre-Closing Single Price Auction (CPSA) from 16:00–16:10 Sydney Time, with the actual match occurring between 16:10 and 16:12.
EUROPE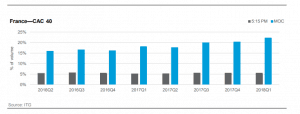
MOC relative share has grown by more than 40% in CAC 40 names. During the same time period, trading share in the final 15 minutes has remained virtually flat. Like most European exchanges, the MOC facility at Euronext Paris is separate from continuous trading. Continuous trading ends at 17:30 Paris time, at which time the closing auction opens. The closing cross occurs at a randomized time between 17:35 and 17:35:30.
Both France and Germany have also seen large shifts in closing volumes. CAC 40 names increased by 40% while the DAX increased by 20% over the same 2-year period.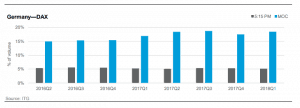
MOC share grew roughly 20% over the past two years in DAX names. This is more modest than most of the markets we studied, although still very meaningful. During the same period, we saw a very minor decrease in relative share traded during the final 15 minutes of continuous trading. The Deutsche Boerse auction, like Euronext Paris, runs post the continuous trading session and has a randomized end time. The auction begins right at 17:30 and runs through 17:35 Frankfurt time. As is the case with most European closing auctions, the Deutsche Borse publishes updated indicative size and price data during the auction.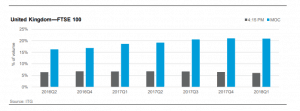
MOC share of FTSE 100 stock trading is over 25% over our study period. During that same period, trading in the final 15 minutes is down very modestly. The LSE Closing facility is similar to many of the European markets we have explained above. The auction is a separate book that runs from 16:30–16:35, after the close of continuous trading.
NORTH AMERICA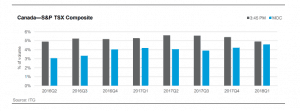
The roughly 5% of market volume traded in the Canadian close is the lowest by far of the 8 global markets analyzed in this paper.
Closing volumes in S&P/TSX Composite names have grown by greater than 1.5 percentage points to 4.6% over the past two years. During the same period of time, we have seen trading in the last 15 minutes grow and then revert back to historic levels. The 5% of share level is the lowest, by far, of any of the markets we examine in this paper. The lower relative levels of closing volume are likely best explained by both the relatively high exchange fees of the Canadian closing facility and the high level of intraday turnover in Composite names, resulting from arbitrage between fungible listings of like names in the US market.
The Canadian close runs at 16:00 pm Toronto time, with orders being entered during the regular trading session. The closing auction has a single imbalance publication at 15:40 pm. Updated imbalances are only given at 16:00 pm if a given name is going to move more than 3% from the last tick.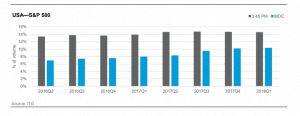
S&P large-cap names have seen more growth in MOC share than small or mid-cap stocks.
The US market, like those of Japan and Canada, has higher levels of trading in the final 15 minutes than the auction itself. That said, auction share has grown dramatically over the last year.
The US is unique, in that it has two large exchanges running slightly different closing auctions. Both facilities run alongside the continuous trading books, but the NYSE facility has Designated Market Makers (DMMs) participating in the price-setting process, while Nasdaq does not. The two markets have surprisingly similar levels of MOC participation, suggesting that structural differences have little impact on investor use of an auction. We also sliced the US via a few other attributes and observed a few interesting trends:
- S&P large-cap names have seen considerably more growth in the MOC share than small- or mid-cap stocks. Large, mid and small market caps saw a similar percentage traded in the close back in Q2 2016, large caps ended over a full percentage point higher than mid and small in Q1 2018.
- ETF volumes traded a modest 3.4% in Q2 2016 and increased to a high of 4% in Q3 2017. While still much lower than what we see in the equity space, this is nearly a 18% increase.
Perhaps the most interesting finding we discovered in the US market was the uptick in trading during the final minutes of the continuous session (3).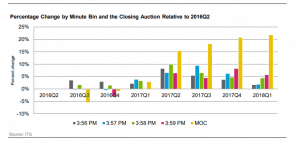
The last four quarters has seen a real shift in trading in the last 4 minutes of the day as well as closing auction compared to 2016.
The chart above shows the relative growth of share for each of the last four single minute buckets, as well as the auction, relative to Q2 2016. The last four quarters has seen a real shift in trading in the last 4 minutes of the day as well as closing auction compared to 2016. This is clear proof that not only has the use of the closing auction changed, but the compression of trading also exists within the final minutes. This is true of both NYSE and Nasdaq trading, and thus not only driven by the increased usage of the d-Quote mechanism on the NYSE.
This chart suggests a variety of questions, which we will attempt to address in future articles. Among them:
- Why is trading being compressed in the final minutes?
- What impact does this have on the closing price?
- Does the growing usage of MOC benchmark guarantees in any way explain this trend?
- How does one think about TCA on a guaranteed close trade?
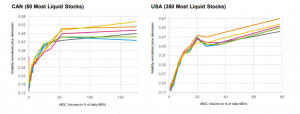
Having looked at the evolving size of the closing auctions, we want to try to start to answer the common question, “Which of the various MOC mechanisms is the most efficient?” This seemingly simple question can quickly become incredibly complex as one considers different trading sizes, geographic volatility, and the dispersion of results across different market caps and liquidity regimes. For our first pass, we have decided to look at only the most liquid names in each market and to normalize for volatility among the markets. We have first compared the closing price to that of a variety of VWAP prices, ranging from the last 5 minutes of trading up to the last 30 minutes. We then consider the price drift found the following day. The results below suggest that we get very similar qualitative results for t=5, 10, 15, 20, 25 and 30 min for all markets under consideration. The x axes show the normalized realized MOC volume (divided by MDV), and the y axes show the absolute value of the price dislocation (4).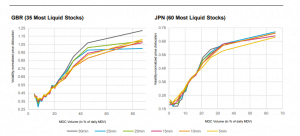
If we compare the closing price to the last 30-minute VWAP for all markets, we can produce a single chart showing relative performance.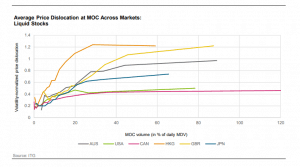
Our data shows that Canadian and US facilities have the least price elasticity, while the auction in Hong Kong has the highest impact.
This chart suggests that the Canadian and US facilities have the least price elasticity, while the North American closing auctions are more efficient. While dislocation from the CLOB is one important factor in market efficiency, other factors like price drift and ability to easily replicate a price are also important. To this point, markets like Shanghai and Mexico use a VWAP price to determine the official close.
As promised, we then consider the next-day drift.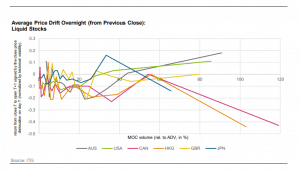
Our goal of the first paper was to highlight the shifting nature of closing liquidity and we look forward to hearing client feedback and questions.
Interpretation: A negative value indicates possible price drift from the previous day’s closing price. Corporate action events and large overnight returns were filtered out from the analysis. We find that Canada and Hong Kong have the highest levels of drift, particularly on larger ADV trades. In future papers, we will take a deeper look at this price drift and how it has changed over time. In particular, the change in drift as end-of-day trading has compressed to within the final minute tells an interesting story. Overall, the drift stats are very noisy, particularly for smaller trades, and need to be considered with a grain of salt.
Our goal with this first paper was to highlight the shifting nature of liquidity around the globe and give some thought to the relative performance of the various closing mechanisms. In the coming weeks, we will be publishing further papers that take a deeper, quant-driven look at trading performance around the close. Among the questions we will consider are how to compare closing trades to alternative trading strategies, where impact costs are realized for larger closing trades, and ultimately how to think about both close trade implementation and measurement. Liquidity is constantly shifting, and as such we will never have a final answer on how to trade any given close trade. Instead, we are aiming to create a better framework for thinking about the close in a dynamic fashion. We look forward to hearing client feedback and questions in order to better inform our own research.
(1) Our analysis focused on stocks included in market-level indices.
(2) A median of the individual stock’s bin trading as a percentage of daily stock’s trading, weighted by the VWAP price.
(3) Aggregate share volume in minute bins across stocks during the quarter as a percentage of aggregate daily share volume. Universe includes stocks traded on average above $1 and $50k daily volume during 2018Q1 in the US (3400 Equities).
(4) The closing price was compared to the mid-quote price x minutes before the close (where x minutes can be 30min, 25min, etc.).