Authors
Duncan Higgins, Managing Director
Andre Nogueira, Director
Vesna Straser, Director
Since the implementation of MiFID II on 3 January and the Double Volume Caps (DVC) on 12 March of this year, the European equity venue landscape has gone through some significant changes.
Earlier this year, ITG published a paper detailing the changes in venue use for institutional investors trading via algorithms. In this update, we also include an assessment of trading costs experienced on different venue types to help clients navigate this new eco-system.
The performance analysis covers data from 1 May to 23 August (post-DVC cap implementation). The trading venue distribution now covers the period from Q4 2017 up to August 23 of this year. The dataset includes transactions from over 40 contributors and includes over 25 million trades. Adjustments were made to remove certain contributor data from the analysis where their trading volumes were greater than 50% with a single counterparty, plus we are using an arithmetic mean across all cost metrics at the broker-level as opposed to a weighted average in order to support broker bias smoothing for the newer venues.
AN EXPLANATION ON ITG’S VENUE TAXONOMY
For the purpose of this analysis, we kept our previous venue taxonomy, grouping venues into six (6) categories, covering both pre-existing venue types and new venue types. Pre-existing venue types include lit venues (regulated exchanges and the lit books of multilateral trading facilities), dark multilateral trading facilities (MTFs) and broker crossing networks (BCNs) which ceased to be able to operate at the start of the year. New venue types include systematic internalisers (both bank sponsored systematic internaliser and electronic liquidity providers – non-bank – systematic internalisers), plus periodic auctions. We mapped individual Market Identifier Codes (MIC) for each venue in the peer database to one of these six categories for this analysis.
BROKER ALGORITHM VENUE USAGE PRE- AND POST-MIFID II
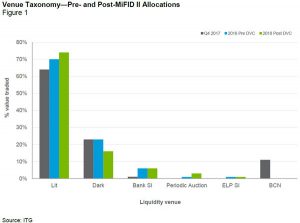
Figure 1 is an update on our earlier analysis on the venue landscape shifts under MiFID II for European equities1. The overall conclusions from the initial analysis hold firm:
- The adoption of both types of systematic internalisers and of periodic auctions as a source of liquidity for broker algorithms has been more gradual than anticipated (only bank-sponsored systematic internalisers gained significant traction as a liquidity source in 2018).
- The value traded on dark multilateral trading facilities has gone down in 2018 versus Q4
- When considered together, trading on these alternative venues did not fully offset the 11% loss of dark liquidity sourced from broker crossing
- In view of that, the increase in lit venue activity in 2018 is a realisation of the regulatory goals intended with MiFID
This increase in lit activity is not shared equally across algorithm types. Figure 2 shows the proportion traded in the different venue types for the major categories of algorithm. VWAP algorithms, for instance, see a halving of the contribution to execution that comes from alternatives to the lit market.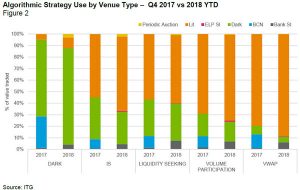
VENUE PERFORMANCE COSTS
To compare the cost of trading in different venues we narrowed the period to after the implementation of the DVCs but maintained the filters for broker concentration. We analyse the execution price against four short term benchmarks around the trade. We took the European best bid and offer (BBO) and calculated the mid-quote at 5 seconds and 1 second prior to execution and 1 second and 5 seconds post execution.
Lit venues
For lit venues, we broke down the analysis into two parts; aggressive fills (crossing the spread) versus passive fills (taking the spread).
Figure 3 shows the costs resulting from aggressive executions on lit venues. We observe that the cost of taking liquidity when compared to a pre-trade mid-quote benchmark is approximately 2.5bps or half a typical spread of a large cap stock. This is consistent with the concept of crossing the spread to trade. Post execution this cost differential disappears with the execution price being much closer to the mid-quote after 1 and 5 seconds. This implies that the far touch executions obtained by investors immediately impact the price which is then sustained across the longer time-period.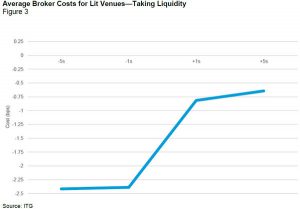
Figure 4 shows the observed costs when trading passively on a lit venue. Prior to execution, the positive cost versus mid-quote is just above 2 basis points, consistent with expectation of obtaining an improve price with respect to the mid-quote when trading passively. However, post-execution in both the 1 second and 5 second measures this outperformance is completely lost. From this observation, we can conclude that institutional investors trading passively in lit markets generally trade when the market is going to move through their price level and a new lower price (for buyers) or a higher price (for sellers) is then established with the investor having traded with higher costs than was otherwise necessary.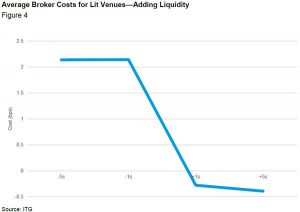
Dark Venues
In Figure 5, we show the same cost measures for dark activity for stocks impacted by the DVCs separately from those stocks not impacted by the caps. This allowed us to clearly distinguish the performance of block trading venues, as dark multilateral trading facilities could only execute orders above large in scale sizes (e.g., 650,000 EUR minimum size on the most liquid names) for capped stocks.
For capped securities (block trading), costs are extremely low both before and after execution. 1 second before execution, costs are just under 0.04 basis points, while 1 second after execution costs are around -0.08 basis points. Costs for non-capped securities showed a slightly changed pattern with pre-trade costs being minimal with some level of price change post execution being observed resulting in negative cost of 0.36bps at 1 second post execution.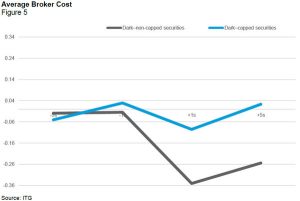
Bank Systematic Internalisers and Periodic Auction Facilities
So how do these costs compare to the trading costs observed when trading on the new entrants to the liquidity landscape? Figure 6 shows the same benchmarks for bank-sponsored systematic internalisers and periodic auctions. Technically, bank-sponsored systematic internalisers have existed since MiFID I, but under MiFID II, the use of such venues has increased significantly.
Bank-sponsored systematic internalisers have the most investor friendly results of all venues assessed. Investors trading through algorithms into Bank SIs are trading at better than mid-prices when compared to pre-trade benchmarks and this benefit is maintained post-trade. Periodic auctions have a similar cost profile to capped dark pools trading in block size, with execution across all benchmarks being close to zero.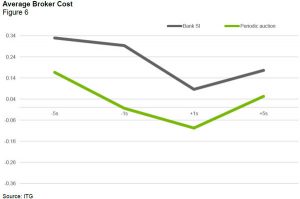
Electronic Liquidity Providers (Non-Bank) SIs and Aggressive Trading on Lit Venues
Non-bank systematic internalisers provided by electronic liquidity providers appear to often be used as an alternative to taking liquidity from the lit markets. We therefore compare the outcomes of these two trading approaches.
Trading on ELP SIs shows a reduced pre-trade cost compared to aggressive trading on the lit markets. This indicates that the price improvement touted by such providers is indeed on offer. In addition to the reduced pre-trade cost the post trade cost indicates a much lower level of price movement after the trade. Adoption of ELP systematic internalisers is still at a relatively early stage (as seen in figure 1), but this data indicates an improved outcome and we would expect an increased use of these venues as firms become aware of the benefits available to them.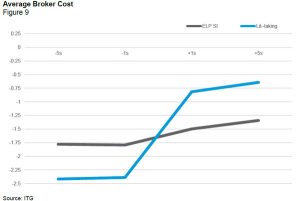
CONCLUSIONS
MiFID II introduced changes to the liquidity landscape across European equities. New venue types have sprung up and brokers’ algorithmic trading strategies are starting to use these new sources of liquidity. In this study, we looked at how liquidity is being sourced by broker algorithms under MiFID II on behalf of institutional clients, and the average cost from trading across various venue types.
We observed that a shift towards trading on lit markets took place under MiFID II in line with regulators’ goals. There has been some uptake of bank-sponsored systematic internalisers, but even when that is combined with liquidity from other alternative sources, it is not sufficient to overcome the elimination of broker crossing networks.
From a cost perspective, we observe that the highest level of cost and price movement post execution are associated with trading on the lit exchanges and MTFs and the lowest costs are seen through trades done on bank SIs, periodic auctions and dark venues for both capped and uncapped stocks. These cost observations, when combined with the increased use of lit markets, are likely to subject the investors trading in European stocks to increased costs. Certainly, the regulatory push to increase the activity of investors in lit markets seems contrary to investors’ goals of reducing costs, which on these metrics, would see them prioritise trading away from the lit markets. Perhaps this new picture of realised costs will give policymakers a deeper understanding of the trading costs before they make any further changes that limit investors’ ability to make use of the lower costs of trading associated with alternative venues.