Outliers have the potential to skew analysis when they aren’t properly accounted for. Addressing outliers, specifically in trade cost analysis (TCA) data, is crucial for traders because it ensures the accuracy and integrity of their analysis. In this article, we explain the concept of outliers, develop an understanding for why they might occur, and discuss how to handle them within a TCA context.
First, let’s define what we mean by an outlier. An outlier is a measurement that significantly deviates or differs from the rest of the data in a group of measurements. For example, if we are measuring the performance of child orders versus the volume-weighted average price (VWAP) benchmark, it would be expected that most of the orders will fall within a range that is close to the benchmark. Sometimes, there are orders with performance figures that are very different from a majority of the other orders, these would be considered outliers.
Let’s define more precisely what we mean by ‘close’ or ‘very different’ in a few ways (i.e., at what point does an observation become an outlier?). One approach is to measure the mean and the standard deviation of the measurements made. For example, if we have a few hundred child orders and have measured the performance of each with respect to the VWAP benchmark, then we can identify orders that are some number of standard deviations away from the mean (e.g., three standard deviations from the mean). Alternatively, we can measure the range that a certain percentage of the data falls into and consider orders outside of the range to be outliers. It’s a bit like the Sesame Street skit where ‘one thing is not like the others’, but there may be many ‘things’ being compared.
There are several reasons why it’s important to identify outliers. First, it may be that the reason an order shows up as an outlier is that there is a data issue. If this is the case, the data should be repaired, and the analytics should be re-computed to see if the order is still an outlier. Another possibility is that there is good data, but there is a problem with the calculation. Again, by identifying the outlier and looking into it, if there is a calculation error, the bug can be fixed, and the data can be re-computed.
Things get more interesting when data and calculation problems have been ruled out, and it’s been determined that the performance of the outlier is ‘real’. In general, when looking at aggregated TCA reports, we are not concerned about orders that did what we expected them to do. We are very interested in orders that didn’t do what we expected them to do because we can learn from these outliers and adjust how we engage with the market.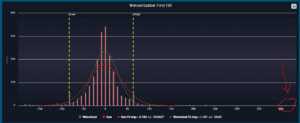 Figure 1: A plot the performance vs the mid-point at time of first fill for a set of simulated TCA orders. There are three outliers at around 400 bps on the positive side of the distribution as well as a handful of outliers on the negative side. The outlier at 400 bps will have a large effect on the average of the group. If we include the outlier without any special handling, we get an average performance of -0.788 bps. If we winsorise the data by replacing extreme values with less extreme values (the x-value of the yellow dashed lines), then the average performance becomes -1.10 bps. The choice of the limits is somewhat arbitrary and charting the data can help the analyst determine appropriate values.
Outliers can have a disproportionate impact on the overall performance of a group when performance is aggregated: one outlier can skew the average of the group. As value weighted averages are often used when aggregating TCA metrics, the outliers should be handled appropriately so that the average amounts are not skewed.
What do we do with these outliers? Our Best Ex Analytics for Smarter Trading solution uses two basic approaches. The simplest is to remove the outliers from the analysis. This is appropriate when bad data is suspected. These observations are referred to as ‘exceptions’ because they are removed from the calculations. When there are ‘real’ outliers (extreme outcomes that happened in the market and are accurately measured) a process called winsorisation can be used. Winsorising the data involves replacing extreme values (i.e., outliers) with less extreme values. For example, if there is an observation that is five times the standard deviation away from the mean, the value can be replaced by the value at three times the standard deviation. In this way, the outlier still contributes to the aggregate performance, but not as much as it would without winsorisation. Figure one above shows an example.
In summary, when working with real-world data, like TCA data, real-world problems like bad input data need to be addressed. It’s important that aggregate analytics aren’t disproportionately impacted by a few outliers. As a result, there needs to be a way of handling these outliers. There is no perfect solution in the messy world of large data sets; however, techniques such as winsorisation can be used to keep the observation but reduce its influence on aggregate metrics like value weighted performance.