

Prashanth Manoharan
Before the US and Israeli strikes on Iran on 1 March 2026, European equities were broadly performing well – the STOXX 600 had reached its highest close above 633, sentiment was positive and macro data strong. Then the war started.
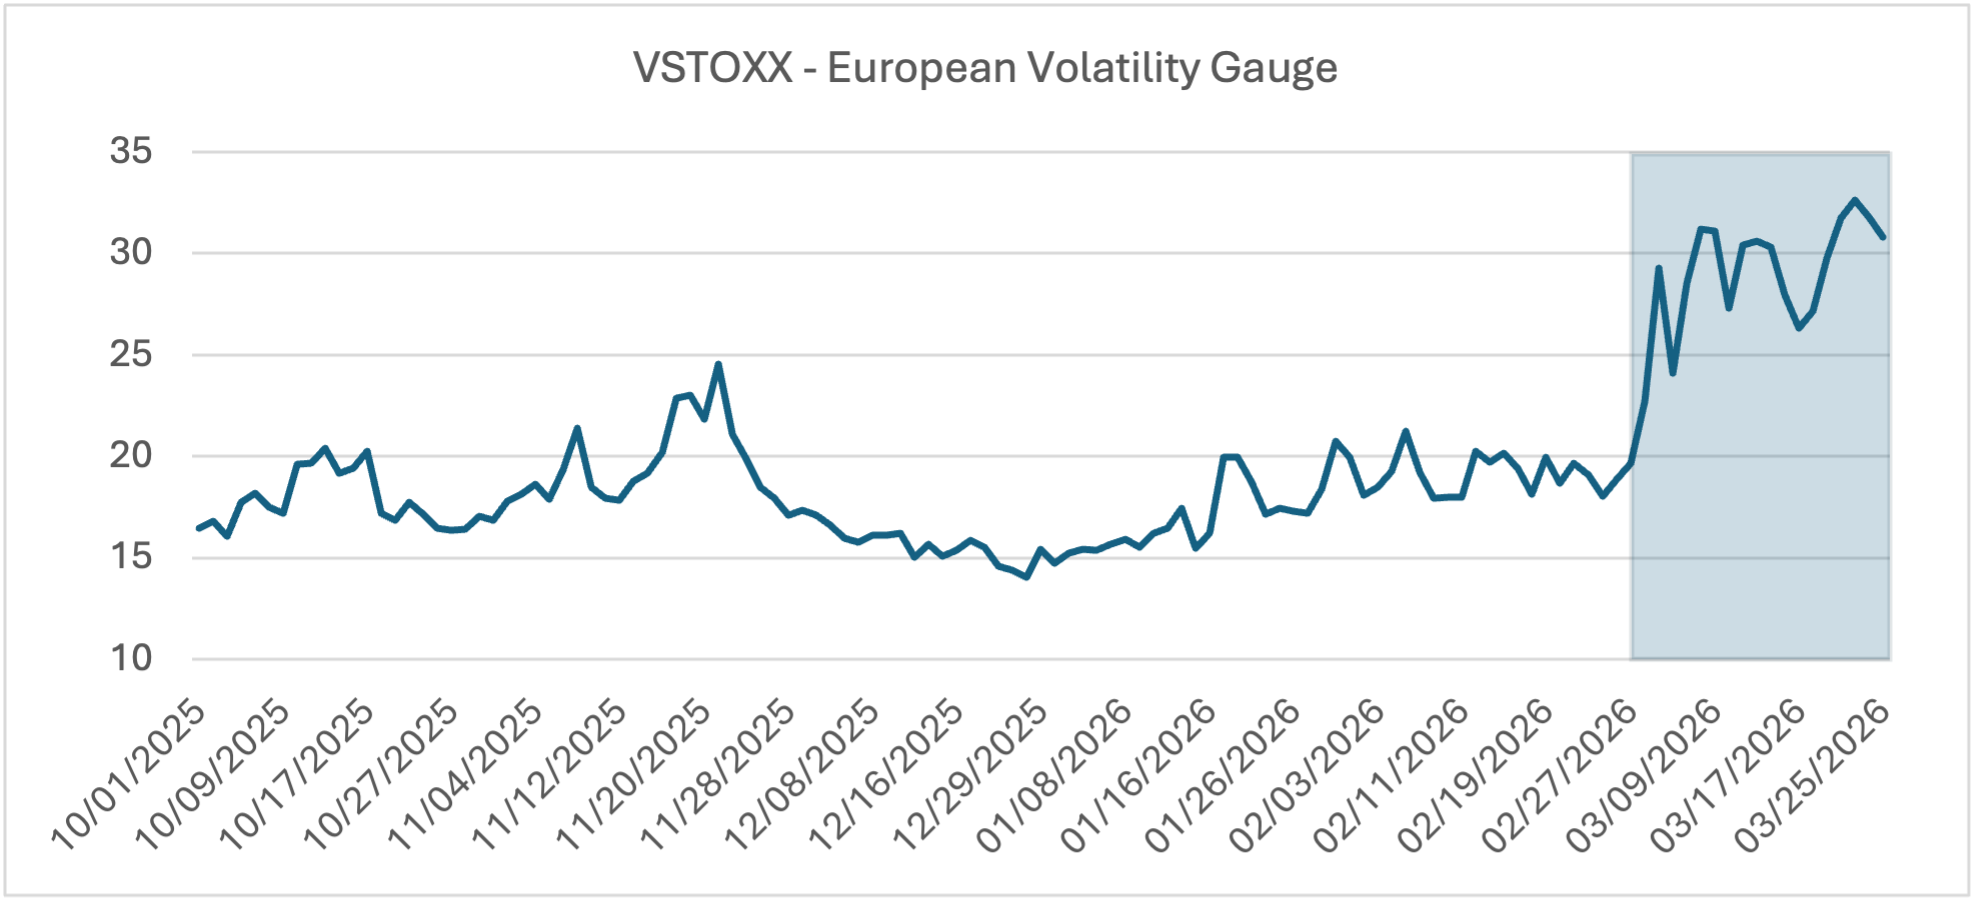
Across Europe, the main indices fell, with STOXX 600 down by -9.6% from the February all-time high. VSTOXX, Europe’s volatility gauge hit its highest level since mid-November on day one of the conflict.
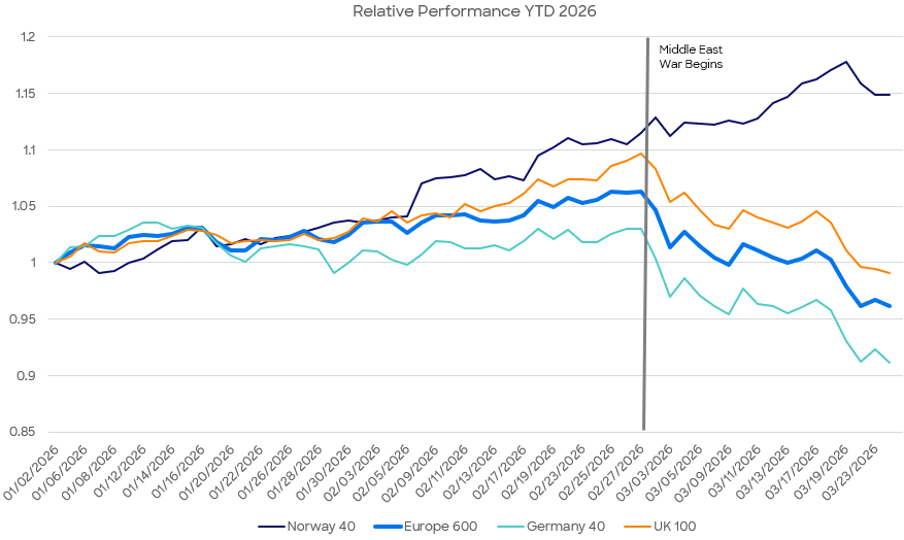
For Europe, the conflict has re-exposed longstanding structural vulnerabilities with significant implications for regional equity markets. Like the 2022 energy crisis after Russia’s invasion of Ukraine, the continent is facing a surge in input costs. The resulting divergence in stock market performance between European energy importers (Germany, UK and Ireland) and exporters (Norway) has driven a structural shift in the cost and complexity of trading.
Source: Bloomberg & Liquidnet internal
For the buy-side, understanding how this divergence is driving a structural re-rating of European markets is essential to adapting trading strategies to a complex and rapidly changing liquidity landscape.
Asymmetric shock
The European market reaction to the conflict was not just a selloff, but a systemic repricing.
While increased cross asset correlation caused by unwinding and more tightly linked index moves are typical of higher volatility and geopolitical stress, beneath the surface unusual dispersion began to emerge. Certain sectors such as energy and defence benefited from the surge in commodity prices and the rotation into defensives. Meanwhile, sectors like luxury, materials, travel and leisure, and financials came under intense pressure from higher input costs, deteriorating market sentiment, and reduced earnings visibility.
Source: Bloomberg & Liquidnet internal
As a result, markets that are nominally part of the same European equity universe are now displaying radically different liquidity profiles. Energy exporting stocks, such as those represented by Norway’s main index, are attracting flows, improving spreads and depth, while energy importing markets are experiencing wider spreads, thinner books, and elevated impact costs.
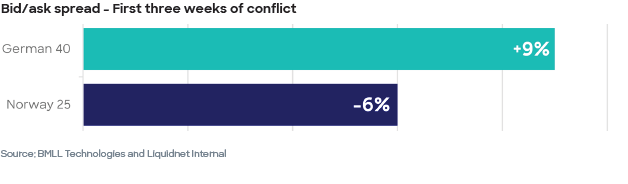
Source: BMLL Technologies & Liquidnet internal
Even within a period of high volatility – normally a correlation driven regime – the asymmetric nature of the energy shock has created unusually strong cross-country and cross-sector dispersion across Europe. For traders, this divergence has immediate execution implications:
- High transaction costs: Bid-ask spreads have widened sharply across the STOXX (9% increase on day 1). As the conflict progressed these remained elevated for most sectors, particularly in travel, financials, materials and smaller-cap names, which directly raises implicit transaction costs for institutional orders. Energy stock spreads, although caught in the same jump initially, have reduced past their pre-conflict levels over the last two weeks (to 20 March), indicating the increased demand and liquidity available to market participants.
- Lower touch size: As volatility increased, all touch sizes have reduced. Fewer participants committed large sizes at specific prices due to more uncertainty around the terminal value of these stocks. Is it noteworthy however, that the frequency of trading has increased, leading to higher daily notionals traded overall.
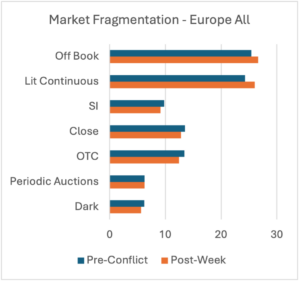
- Shift to lit continuous: In recent weeks, European stocks have seen a shift in liquidity away from the close (-5%) and back into the lit continuous (+7%), as investors seek immediacy of fill to react to news events released through the day. SI and OTC bilateral liquidity also observed a reduction in market share, however off-book on-exchange volumes saw a small increase – perhaps reflecting greater internalisation rates, matching more liquidity at a reduced cost. Again, this was different by sector, where high activity energy names saw a similar but more dramatic change (+20% increase in lit market share to 31.5%, and closing auction dropped from 12.7% to 10.1%).
- Dark pool fragmentation: Dark pool liquidity has fragmented. Typically, in high volatility scenarios, it is expected for dark liquidity to deteriorate as participants seek certainty of fill and move to the lit. This has been the case across most sectors, and the STOXX 600 saw its dark market share reduce by 10% in the first week of the conflict. However, due to this crisis causing asymmetry across names, dark market share increased in sectors such as energy. The first week saw a 32% rise in dark trading as investors sought to maximise liquidity exposure, whilst attempting to capture half the spread – the saving becomes even more significant during high volatility scenarios.
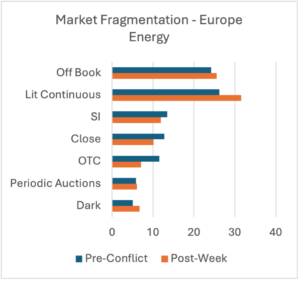
Source: BMLL Technologies (Cboe BEPACP & Cboe BEPENGY) & Liquidnet internal
- Country-level execution implications: Country-level venue selection matters more than usual. Norway versus Germany currently offers fundamentally different market microstructure conditions. Execution desks may improve execution performance by accounting for these changes in spread and depth data per market and not use regional averages.
- Algo performance impact: VWAP and TWAP algorithms are expected to underperform versus their benchmarks in high-dispersion environments. With intraday volatility spiking and flow highly directional in energy and travel names, passive participation strategies could face greater slippage.
- Market-on-close risk increase: With geopolitical headlines arriving intraday and often outside market hours, end-of-day fixing strategies carry heightened gap risk. Traders should carefully consider close participation in geopolitically exposed names.
A new environment
The sum of these changes to European microstructure are set to have lasting impacts on the cost of trading and how firms source liquidity. Buy-side firms trading in size across European names that are not running a dynamic execution strategy that responds to the current spread regime are paying more than they should be. Meanwhile, liquidity seeking strategies that follow volume in-line are likely to be better-suited to this complex environment.
To navigate this complex new environment, traders need to respond and adapt their trading strategies to a distinct new trading environment. Not doing so risks incurring costs, missing opportunities or increasing market risk.
© 2026 Liquidnet, Inc. is a member of FINRA/SIPC/NFA. Liquidnet Europe Limited is authorised and regulated by the Financial Conduct Authority in the UK. TP ICAP (EUROPE) SA is authorised by the Autorité de Contrôle Prudentiel et de Résolution and regulated by the Autorité des Marchés Financiers and is a remote member of the Warsaw Stock Exchange. TP ICAP Markets Limited is authorised and regulated by the Financial Conduct Authority in the UK. Liquidnet Canada Inc. is a member of the Canadian Investment Regulatory Organization and a member of the Canadian Investor Protection Fund. Liquidnet Asia Limited is regulated by the Hong Kong Securities and Futures Commission for Type 1 and Type 7 regulated activities and is regulated by the Monetary Authority of Singapore as a Recognized Market Operator. Liquidnet Japan Inc. is regulated by the Financial Services Agency of Japan and is a member of JSDA/JIPF. Liquidnet Australia Pty Ltd. is registered with the Australian Securities and Investment Commission as an Australian Financial Services Licensee, AFSL number 312525. Liquidnet Singapore Private Limited is regulated by the Monetary Authority of Singapore as a Capital Markets Services Licensee, CMSL number CMS 100757-1. All of the above entities are part of TP ICAP Group plc.
The information provided by Liquidnet is not investment advice nor is it intended as a recommendation to buy, sell or hold any instrument referenced. Any analysis provided is not sufficient upon which to base an investment decision. A recipient should consider its own financial situation and investment objectives and seek independent advice, where appropriate, before making any investment. Although the statements provided by Liquidnet are 3 believed to be correct, they have not been verified and should not be relied upon when considering the merits of any particular investment. All presented data may be subject to slight variations.