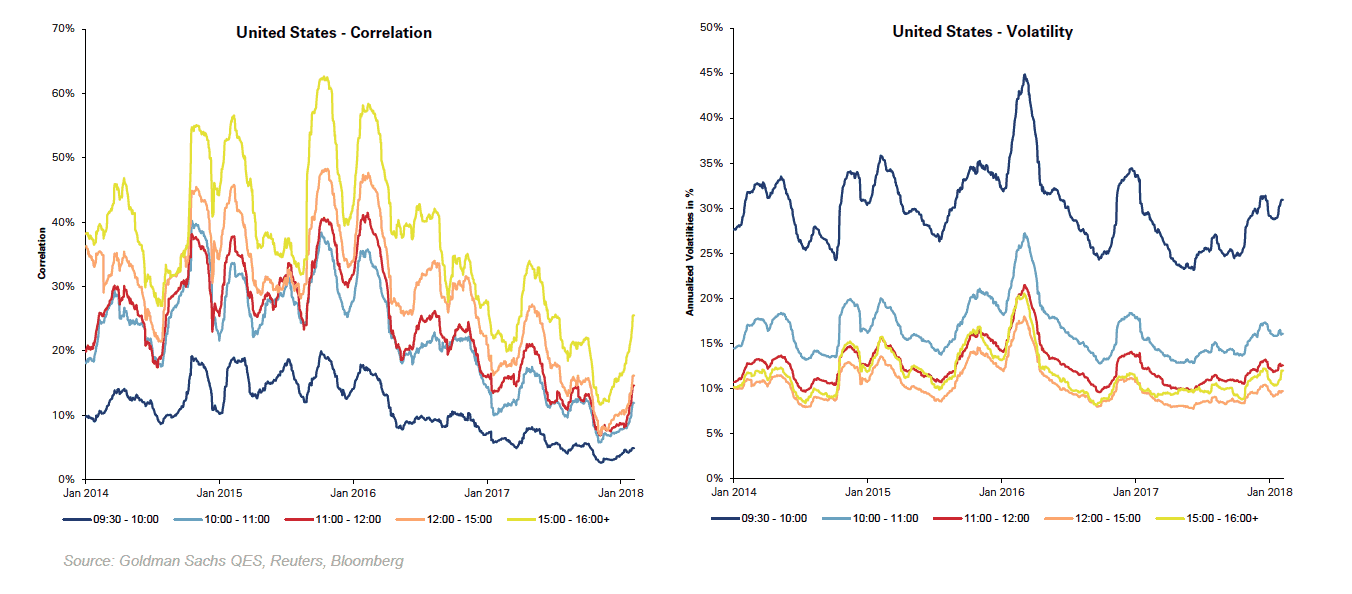
The TRADE > Thought Leadership > Deciphering global execution dynamics for optimal trading > Figure 3 GS March 30, 2020 10:44 AM GMT Figure 3 GS Figure 3: Shifts in intraday correlation and volatility for S&P500 stocks. By Hayley McDowell « Deciphering global execution dynamics for optimal trading