By Duncan Higgins, Andre Nogueira and Vesna Straser, ITG
Since MiFID II’s January 3 go-live date the changing market structure dynamics in Europe have been top of mind for investors in Europe and globally. With more than a full quarter of trading activity since MiFID II took effect, ITG is providing an update on the significant changes in equities markets.
ITG has leveraged its unique broker-neutral TCA Global Peer universe of algorithmic trading to compare venue usage from the end of 2017 through the end of April 2018. This data set provides an exclusive view into how firms are adapting their execution venue choices as a result of the new regulation, including the impact of double volume caps (DVCs) for activity after March 12.
We found that use of both bank-sponsored and electronic liquidity provider (ELP) systematic internalisers has increased so far in 2018, while broker crossing network flow disappeared. All of this confirms our expectations of how MiFID II would affect the overall market structure in Europe. We believe these trends will strengthen throughout 2018 as algorithmic trading providers optimise use of the new and existing venue types.
The most interesting early changes in the venue mix are the emergence of notably different venue profiles for DVC and non-DVC stocks since the DVC implementation. Our data analysis indicates clearly that dark caps created a more fragmented, and likely more challenging, liquidity landscape for capped securities compared with non-capped ones.
Market observations
Across the overall equities marketplace in Europe, trading on dark venues (as % of total market volume) has started to decrease while lit venues recaptured the bulk of the trading volume thus far in 2018 (90+%).
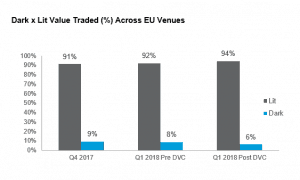
Source: Cboe Global Markets
While this public data provides a useful confirmation of the general outcome, it does not address the specifics of the expected changes. To look under the hood of the emerging venue shifts, we used ITG’s proprietary Global Peer database on algorithmic trading.
That TCA database comprises non-public data with a level of granularity that goes beyond what is available across public sources. More specifically, it includes algorithmic trading institutional client orders across the 28 EU countries and excludes certain algorithmic trading strategies, such as Close, that are not relevant to this analysis. High touch, program trading and direct use of block crossing networks are also excluded.
To reduce bias, we also excluded clients whose executions were concentrated in any single counterparty or execution strategy. We applied additional materiality tests to ensure each category is represented by a sufficient number of orders and clients.
In addition to general dark and lit venue groups, our categorisation applies a more granular view into types of execution venues available under MiFID II. Specifically, we track: traditional lit exchanges (lit), dark MTFs, bank-sponsored systematic internalisers (bank SIs), ELP’ SIs, periodic auctions and broker crossing networks (BCNs). Category Null captures trades with invalid MIC codes.
Movement among the venues
Consistent with our expectations (and MiFID II regulations), the Global Peer data shows that BCNs are no longer in use in 2018. At the same time, bank SIs picked up 6% of the volume and traditional lit venue volume also rose 6%.
Periodic auctions are a new entrant in the European market structure landscape and represent a modest 1% of trading volume in 2018 in our data set. We observe no material changes in the aggregate use of dark MTF venues until March, when we start to see a slight drop. We attribute this to the double volume caps that took effect for European securities on March 12.
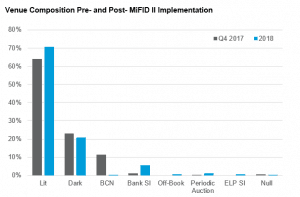
Source: ITG
Enter the double volume caps
Upon closer inspection, we notice that the implementation of the dark caps triggered a significant drop in dark MTF venue trading in our data set for capped securities. The percentage of dark volume in our Peer data for capped securities drops from 27% to just 8%. Only Large-in-Scale orders have been able to continue to trade in these securities on dark MTFs. Reference Price Waiver trading has ceased from this point. In contrast, dark MTF trading volumes for non-impacted securities remain largely unchanged at around 20%.
The drastically reduced dark MTF flow for DVC-impacted securities (-19 percentage points) has not been absorbed by the new kid on the block for MiFID II – the periodic auction. The greatest proportion appears to have migrated to traditional lit venues (+13pp), with periodic auctions (+4pp) and, to a lesser extent, bank SIs (+2pp) picking up the balance.
Before the caps were triggered, DVC-impacted securities saw around 27% of their volume executed in dark MTFs versus 21% for the non-DVC securities. Of interest is the lack of change across venue types for the non-capped securities. In particular, activity on periodic auctions continues to be significantly lower for non-capped securities than for capped securities. Based on this, we can say that the main change for non-capped securities was the start of year movement of BCN flow to Lit venues and Bank SIs in approximately equal proportions.
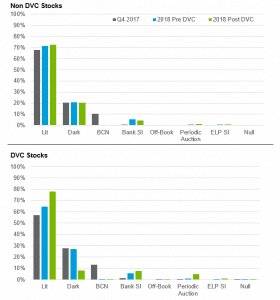
Source: ITG
A tale of two market structures
It appears that MiFID created a dual liquidity landscape with very different venue profiles for DVC and non-DVC stocks. DVC-impacted securities require more challenging liquidity sourcing than non-capped ones. Further implications of this shift still need to be fully quantified. Outstanding areas for analysis include impacts on trading costs, best execution, trading efficiency and impact on owners or issuers of DVC-capped stocks. Are the investors, funds and/or strategies that invest in DVC-capped stocks being disproportionally disadvantaged? How is the change manifested within the individual countries?
Final observations
MiFID II brought significant changes to trading venue composition in Europe, and we have yet to fully feel and understand the effects. Systematic internalisers have sprung up to fill the gap left by the elimination of broker crossing networks. Bank-sponsored SIs have gained market share traction, but the overall early adoption of ELP SI venues is still low. This is not surprising, as most firms are making cautious use of this new execution option.
Some problems with data quality remain, as transactions without standard MIC codes still represented 0.4% of executions prior to DVCs taking effect. This affects not only venue analysis but also one of the heavier technical lifts associated with MiFID II such as trade reporting. We would expect these data errors to decline further before buyside patience wanes and the cancellation of inadvertent trade reports due to data errors becomes a greater issue between the buyside and sellside.
ITG will continue monitoring venue usage dynamics as firms search for the optimal Post-MiFID II liquidity mix for their algorithmic trading flow. As changes settle in, we will also follow up with a comparative analysis of the execution cost shifts for DVC and non-DVC securities. Such an examination of parallel market structures should be of keen interest to market participants and policymakers in Europe and to any policymakers in other parts of the world who may be considering similar experiments.